
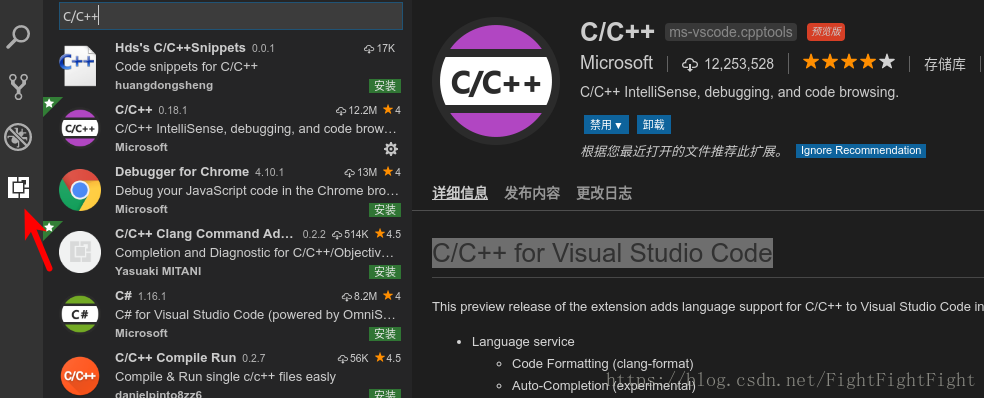
点击左边扩展栏图标—>搜索C/C -> 安装->Reload:
安装完成之后,打开你的包含c 的文件夹,将会生成一个.vscode文件夹,所有的配置将在这个文件夹中进行配置。
扩展程序会根据当前系统环境配置基本信息,因此有可能配置不完整,这时需要通过生成c_cpp_properties.json文件来配置缺少的信息:
ctrl shift P打开Command Palette,运行C/Cpp: Edit configurations...生成c_cpp_properties.json:
{ "configurations": [ { "name": "Linux", "includePath": [ "${workspaceFolder}/**" ], "defines": [], "compilerPath": "/usr/bin/gcc", "cStandard": "c11", "cppStandard": "c 17", "intelliSenseMode": "clang-x64" } ], "version": 4}这是默认生成的c_cpp_properties.json文件,可在这个文件中添加配置。
如果要构建应用程序,则需要生成tasks.json文件:
Ctrl Shift P -> Tasks: Configure Tasks… -> Create tasks.json file from templates -> Others.
{ // See https://go.microsoft.com/fwlink/?LinkId=733558 // for the documentation about the tasks.json format "version": "2.0.0", "tasks": [ { "label": "build demo1", //任务标签 "type": "shell", //类型 "command": "g ", //对应的命令:g -g demo1.cpp -o demo "args": [ "-g", "demo1.cpp", "-o", "demo" ], "problemMatcher": [], "group": { "kind": "build", "isDefault": true } } ]}生成tasks.json后,根据自己需求修改command、args或其他字段。
要启用调试,需要生成launcher.json文件:
点击菜单栏DEBUG->Add Configuration ->选择C (GDB/LLDB)(Windows下选择C Windows) ,这时将会生成launcher.json文件:
{ // Use IntelliSense to learn about possible attributes. // Hover to view descriptions of existing attributes. // For more information, visit: https://go.microsoft.com/fwlink/?linkid=830387 "version": "0.2.0", "configurations": [ { "name": "(gdb) Launch", "type": "cppdbg", //正在使用的调试器,使用Visual Studio Windows时必须为cppvsdbg,使用GDB或LLDB时必须为cppdbg. "request": "launch", //表示此配置是用于启动程序还是附加到已运行的实例上 "program": "${workspaceFolder}/demo", //指定调试器将启动或附加到的可执行文件的完整路径 "args": [], "stopAtEntry": false, "cwd": "${workspaceFolder}", //设置调试器启动的应用程序的工作目录 "environment": [], "externalConsole": true, "MIMode": "gdb", //要连接的调试器 "setupCommands": [ { "description": "Enable pretty-printing for gdb", "text": "-enable-pretty-printing", "ignoreFailures": true } ] } ]}生成launcher.json文件后,点击Debug->Start Debugging开始调试,点击侧边栏的Debug图标可查看BreakPoint、Call Stack等。
来源:http://www.icode9.com/content-1-24961.html联系客服

