打开APP
userphoto
未登录

开通VIP,畅享免费电子书等14项超值服

开通VIP
Drumming Fingers
userphoto

2009.05.12

关注

Wednesday, August 02, 2006

Drumming Fingers

My relationship with the market is pretty bad these days. I find it irksome and frustrating. Everyone seems completely obsessed with next Tuesday's Fed announcement. So everything is in kind of a weird holding pattern until then.

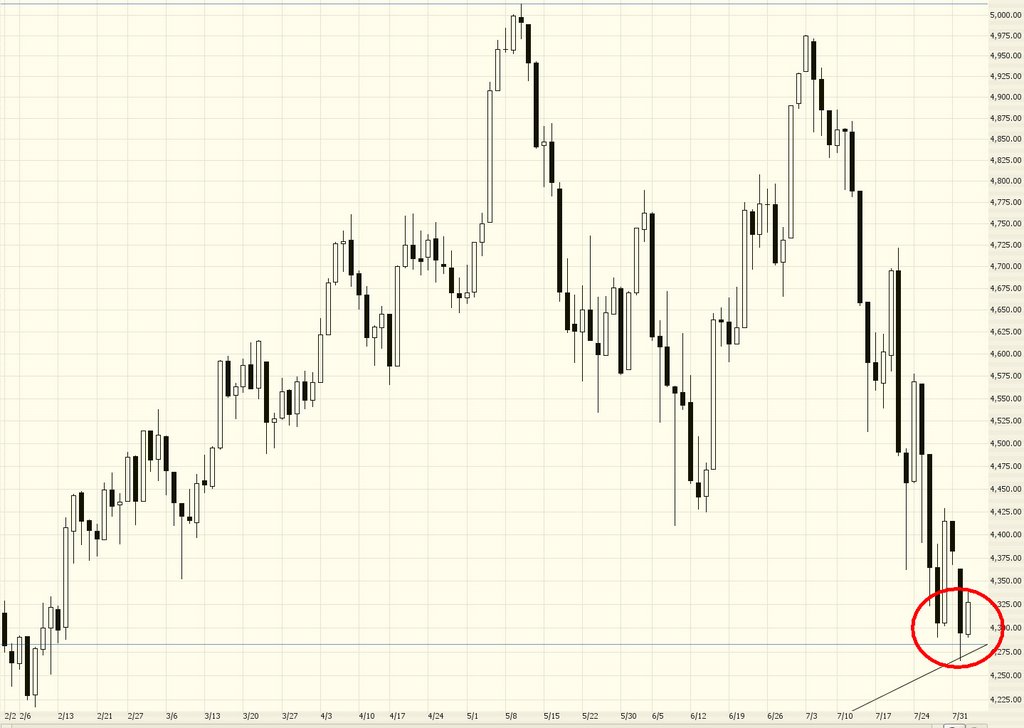
Just as yesterdays 100+ point drop got shaved before the close, today's 100+ point gain got shaved too. The Dow 30 is still below (but, again, just barely below) the "safety line" shown here in red. This is an agonizingly tight spot. If the market continues to be strong, it's going to completely screw up mid-term bearish arguments. If the market falls, it will be textbook technical analysis. But if we have strength, it's time to get out and get out fast.


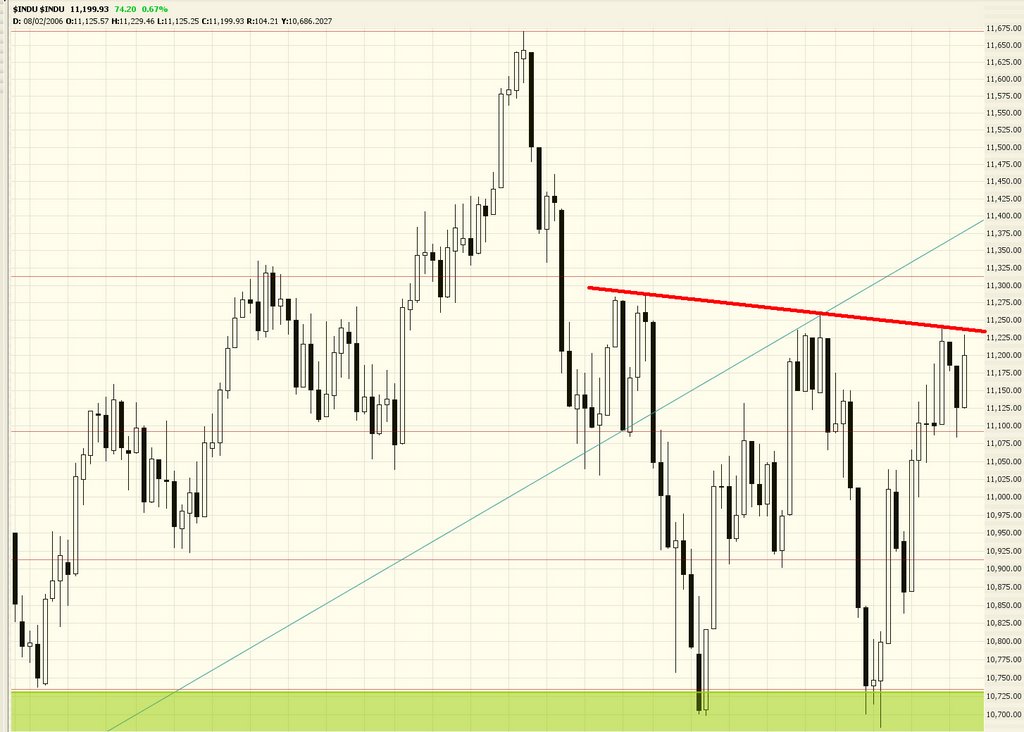
During the peak today, I felt a lot of oil service stocks had really reached their limits, so I bought some more puts there. OIH softened up a bit. I'd still say $152 is a good stop loss point for OIH and, in principal, the component parts of it as well (at different prices, obviously).


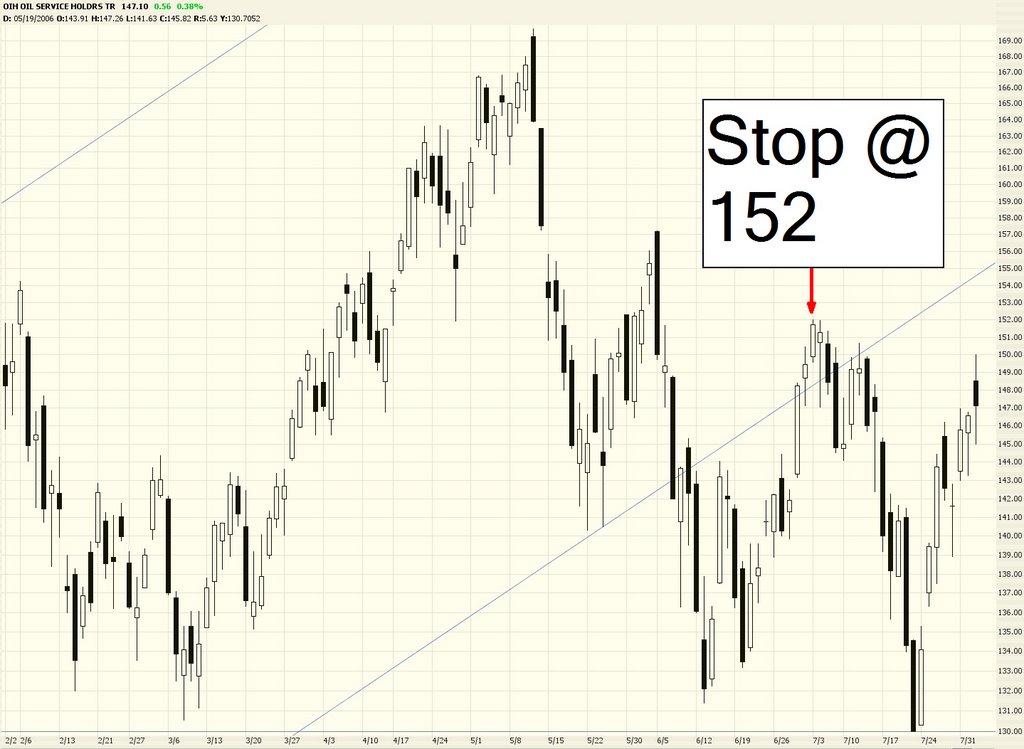
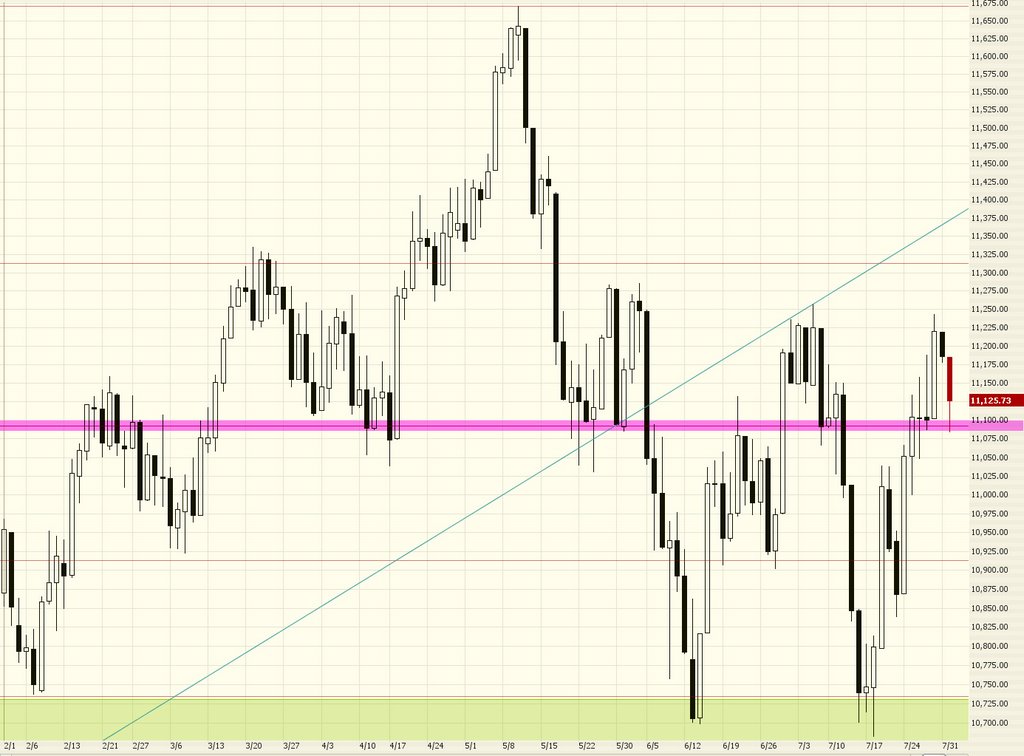
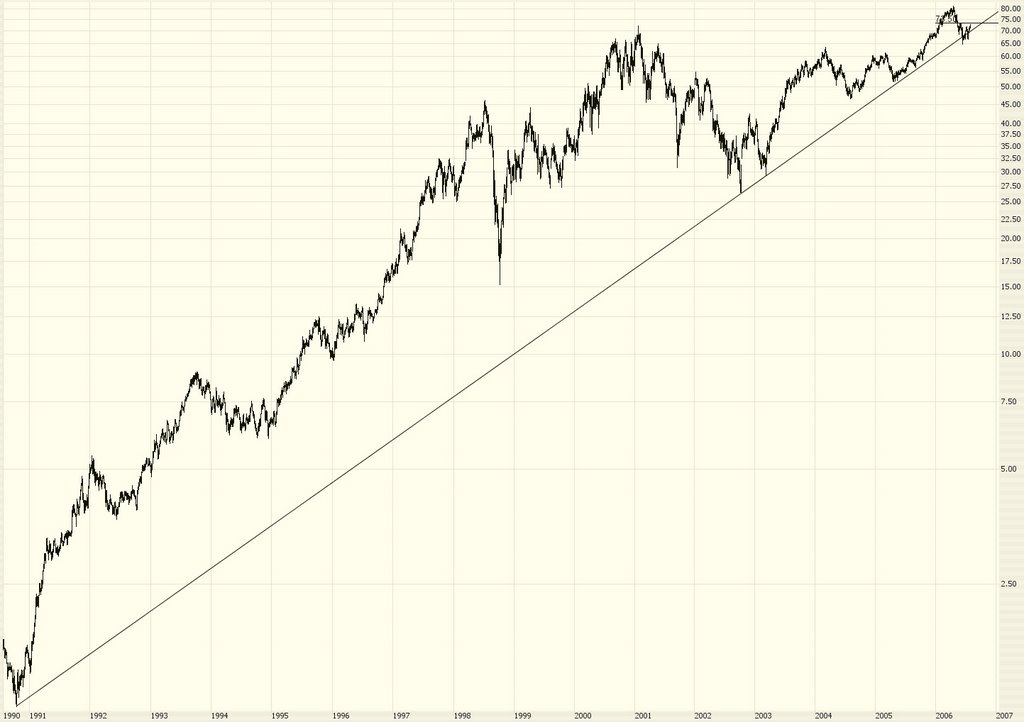
The S&P 500 is clinging to that line like there's no tomorrow. Click on the image to see it more clearly. There's an ascending resistance line that the price is just smooching, day after day. It's kind of weird, I must say, but at least it's predictable for the moment.


If the markets move higher, I've got to believe $TRAN will be especially strong. It's had a horrible time recently, losing the equivalent of about 1,800 Dow points from its peak. But it's at two major support zones right now, and it could easily bounce higher from here given any general market strength.

Tuesday, August 01, 2006

Down is Good

I was pleased the Dow was down 100 points earlier today. However, looking at the chart, I had a feeling it probably wasn't going to go down any farther, at least for today. As the pink line shows below, there is a fairly prominent "line in the sand" indicated by the Fibonacci retracement at around the 11,090 level. I had a bunch of August puts (and with only 13 days left on them, I was getting jumpy) so I got the hell out at a good price. Moments later, the market started to gather up to strength, closing down 60 for the day.


I have a lot of work to do (again, I've got a real job, folks!) so I'm going to keep it short today. Read yesterday's long-ass entry if you haven't already.

Oh, and someone asked for my current positions. Here you are, courtesy of Mr. Indiscrete (click image to actually read them):

Monday, July 31, 2006

Wanted: Clear Direction. Please!

The Dow was down 34 points today. Big deal. This market is so boring these days. There's just no direction. A little tug up. A little tug down. Intraday graphs are like spasms. The S&P 500 is basically exactly where it was when 2006 began. It went up a while. Then it went down a while. And now it's up a little. Zzzzzzzzzzzz........

Oh, before I forget, this blog is now part of the Ticker Sense poll. Thanks, guys! Is there a way to auto-click the Bearish radio button?

If you have the time and the interest, here's a fascinating (and long) article about large economic trends, particularly centered around debt and interest rates. Bottom line is that a recession is virtually a foregone conclusion.

Oh, one other thing. By happenstance, I found this KlipFolio product. Download it - it's free! And you can add your favorite blog (ahem) to it.

I have two standards for judging new software: does it work right/feel right immediately out of the box (the answer for Klip: yes!) And am I still using it in a couple of weeks? (We shall see!) I've sometimes become jazzed about stuff that I never touch again. Which means, to me, it's not useful. Klip seems awfully cool, though.

OK, on to charts. And there's a bunch of 'em today. Because I've got to believe the market will eventually snap out of this boring funk. And, if there's a God (or at least a sensible God), the market will fall big-time. So let's be prepared, Scouts.

HANS has been fascinating to me for a long time. It has bagged a nearly 10,000% gain over the past couple of years, and I think everyone on the planet is waiting for it to snap at some point. Here's the astonishing graph. Some people have become very, very rich on this stock:


Let's take a closer look. This graph is more recent, and it features two moving averages on the price graph as well as a moving average on the volume graph. Notice a few things. First, volume is really starting to soften on this stock. Second, the 50 day moving average hasn't crossed below the 100 day moving average in a very long time. I'd take this as a strong sell signal if it does. To be honest, I'm short the stock already. I guess I (foolishly) want to get in early on what I hope will happen.


I want to put the S&P graph up again simply because it's so beautiful. You can see all the drawn objects I've laid down on this graph. It would take an amazing amount of bull power (you can think of a more colorful term) to turn this market decisively upward. But it's happened before. The jury is still out right now. There are many strong forces at work that could rip the guts out of this market.


From here on out are graphs with stop prices. Simple. I think all of the following charts are optionable, so you might want to pick up puts. The stop price I cite is the price above which the position should be closed. First up: AMG 95.05


ATW 50.64


DIA 112.56


HUM 58.26


IYR 75.02


MER 73.50


MO 81


MON 43.86


OIH 152


Good luck! And, remember boys and girls, if you want to see a bigger graph, just click on any of the small images. Click Back to return to this blog. See ya....

本站仅提供存储服务,所有内容均由用户发布,如发现有害或侵权内容,请点击举报
打开APP,阅读全文并永久保存
猜你喜欢
类似文章
各大寺庙的经典对联
脑梗名方:生黄芪、鸡血藤、当归、赤芍、桃仁、红花、地龙、生白术
摄影:奇特的野生植物--蛇梅
一天认识一个国家——(125)科摩罗
锦溪古镇风光(19)
〖佳方汇集〗28个壮阳秘方
生活服务
热点新闻
分享 收藏 导长图 关注 下载文章
绑定账号成功
后续可登录账号畅享VIP特权!
如果VIP功能使用有故障,
可点击这里联系客服!

联系客服